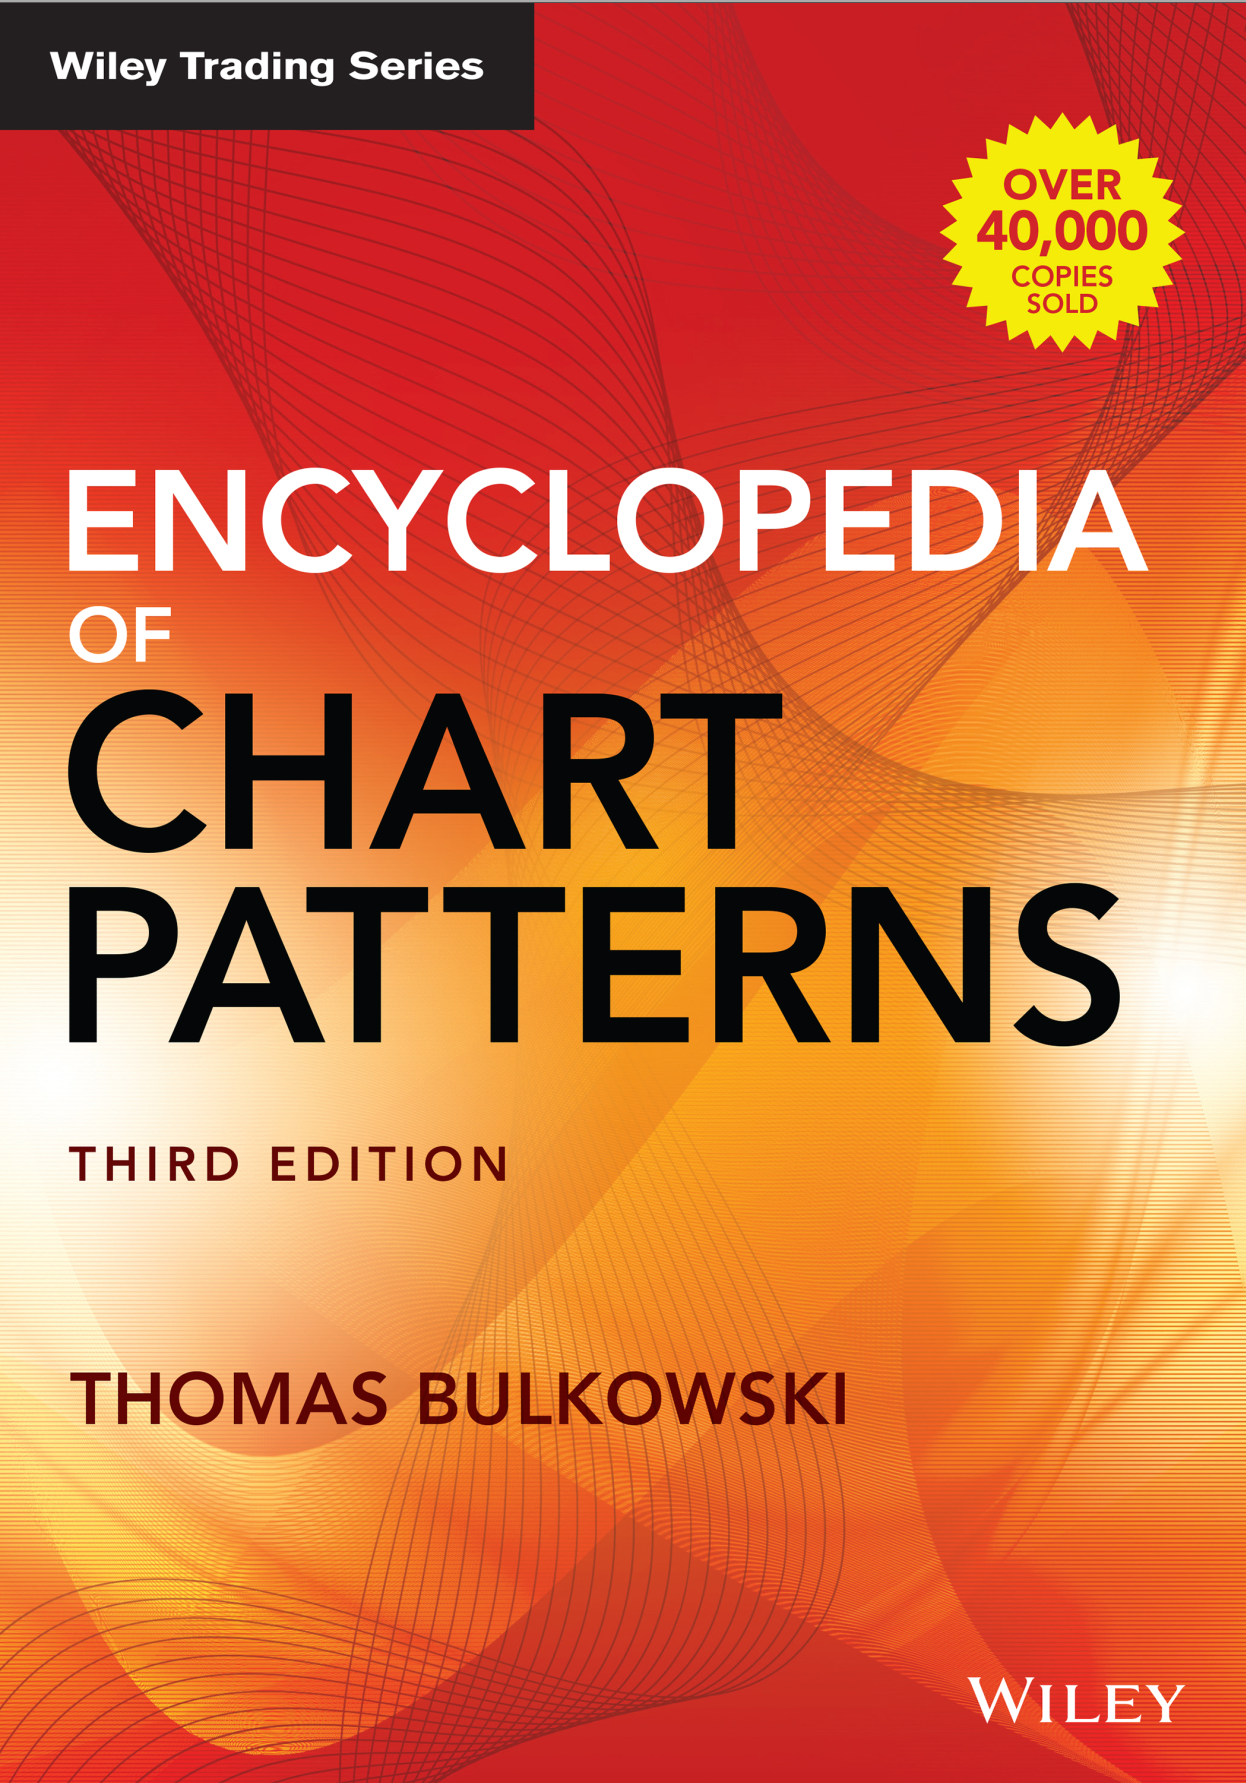
Review – Encyclopedia of Chart Patterns by Thomas N. Bulkowski

Thomas Bulkowski’s Encyclopedia of Chart Patterns is one of the most comprehensive and data-driven works ever written on technical analysis. First published in 1999 and later expanded in its second edition, the book stands as a cornerstone reference for traders who want to understand how price patterns behave in the real world — not just in theory.
Unlike most trading books that rely on intuition or anecdotal examples, Bulkowski takes a scientific approach. He analyzed thousands of historical stock charts to quantify how often each pattern appears, how reliable it is, and what kind of price performance typically follows a breakout. The result is a massive collection of research covering more than sixty classical patterns — including Head and Shoulders, Double Tops and Bottoms, Triangles, Flags, Pennants, and many others.
Each chapter follows a clear and consistent structure: it explains what the pattern looks like, the psychology behind its formation, the typical mistakes traders make when identifying it, and — most importantly — statistical results on success rates, failure rates, and average gains or losses. Bulkowski even provides “performance rankings” so traders can compare which patterns are most effective under different market conditions.
The book’s strength lies in its quantitative rigor. Bulkowski doesn’t simply tell you a pattern “works” — he shows you how often it works, by how much, and under what circumstances. For traders who rely on evidence rather than intuition, this makes the Encyclopedia invaluable.
That said, the book is not light reading. It’s dense, methodical, and reads more like a research manual than a motivational guide. But for anyone serious about developing an evidence-based trading strategy, this depth is precisely what makes it so valuable. The writing is clear, objective, and free from hype, reflecting Bulkowski’s engineer-like precision.
Overall, Encyclopedia of Chart Patterns is a landmark contribution to technical analysis. It bridges the gap between art and science in chart reading, turning subjective patterns into statistically measurable tools. Whether you’re a beginner learning how to recognize formations or an experienced trader refining your strategy, Bulkowski’s work provides both the framework and the data you need to trade with greater confidence and realism.
In short: this isn’t a book that promises quick profits — it’s a book that teaches discipline, research, and respect for market behavior. And that’s what makes it timeless.
